Visualizing Complex Files
Inspired by a very interesting TED talk by Chris Domas, I decided to make my own tool that did the same thing. Download the binary (.NET compatible) Download the source code As you can tell from the source code, the mechanism is very easy:
- Split file into bytes
- Loop through the bytes (currentByte and previousByte)
- X axis is 0 - 255 (currentByte)
- Y axis is 0 - 255 (previousbyte)
- Plot intersections of X and Y
The technical name for this is digraph. Doing this in 3D or 4D would require a very similar process. Below are screenshots of some of the files that I visualized. 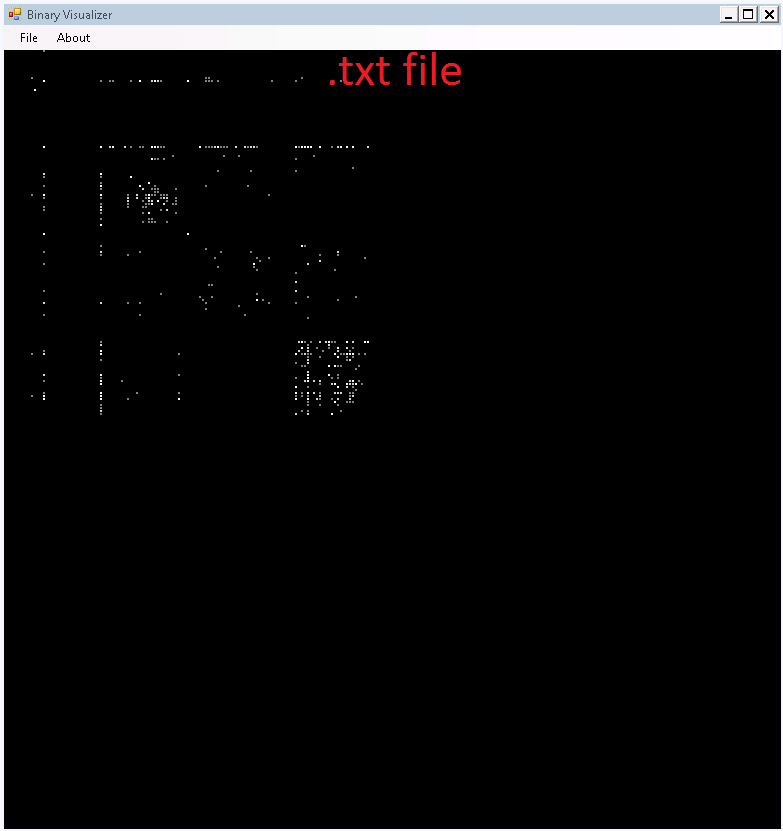 Note how everything is in the upper left corner. That's because bulk of plain text is ASCII bytes 32 (space) to 126 (~)
 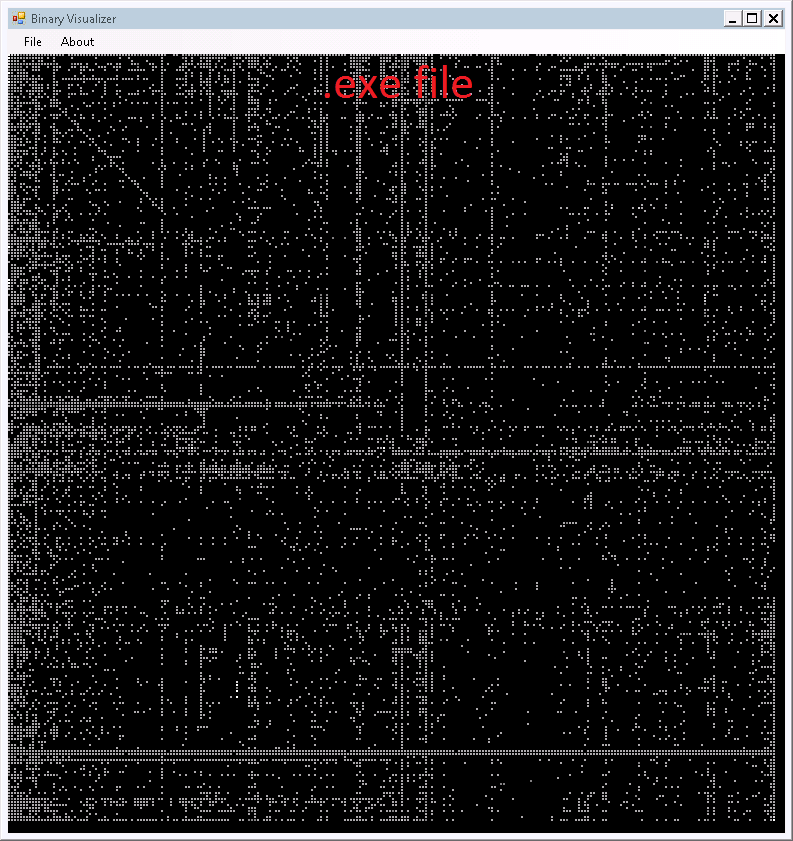 Some similarities to a text file in terms of well defined patterns except that binary file won't be restricted to below byte 127.
  Notice the shades of gray.
  This was about 32 MB file. If I had a bigger file that was even more random I would expect the entire screen to fill white. Any pattern visible here is a tale tale to a lack of randomness (or a small sample)
- ← Previous
Pingb: Bandwidth Measuring - Next →
IPv6 for the impatient